VR, or Virtual Reality, has definitely gained more media traction within the past few months, especially with the attention that VR hardware received at this year’s CES. Amidst the now mainstream coverage (and inevitable coming wave) of VR products and technology, Valve has entered the conversation by releasing the SteamVR Performance Test to Steam users and letting gamers and hardware enthusiasts alike to download the program and see what score their systems earn.
With the easily downloadable and convenient nature of the SteamVR Performance Test, a flurry of conversation has sparked in forums and communities to try and debate how important specific components are in gauging performance.
I decided to take the initiative to use the hardware at my disposal and answer this question among the varied PC hardware market and narrow it down to variables that can kept constant. Since Valve’s test focuses on “whether capabilities are bound by Graphics Card, CPU, or both,” I tested graphics cards from the two major players in the GPU market – NVIDIA and AMD, and used Intel CPUs ranging from a low end i3 to the highest end Extreme Edition i7.
CPU
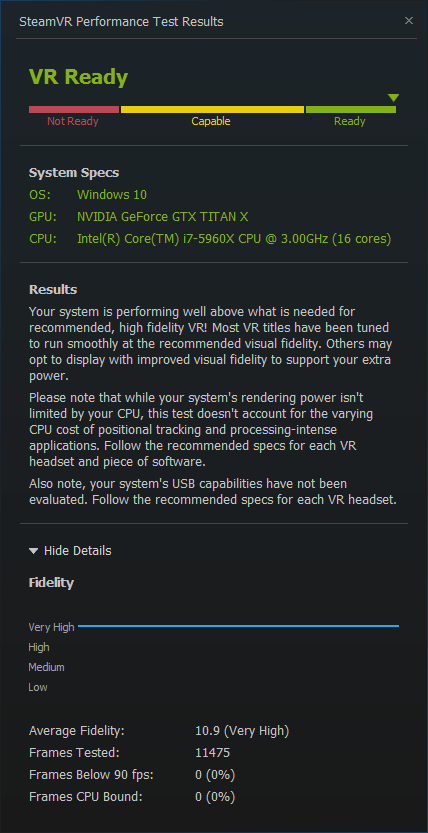
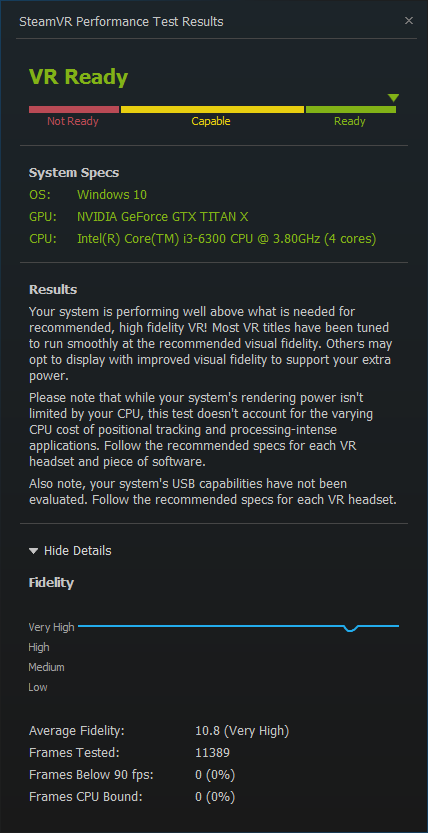
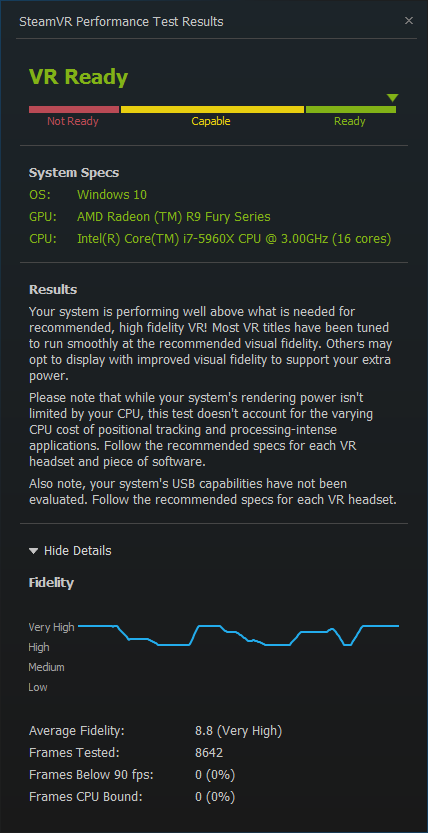
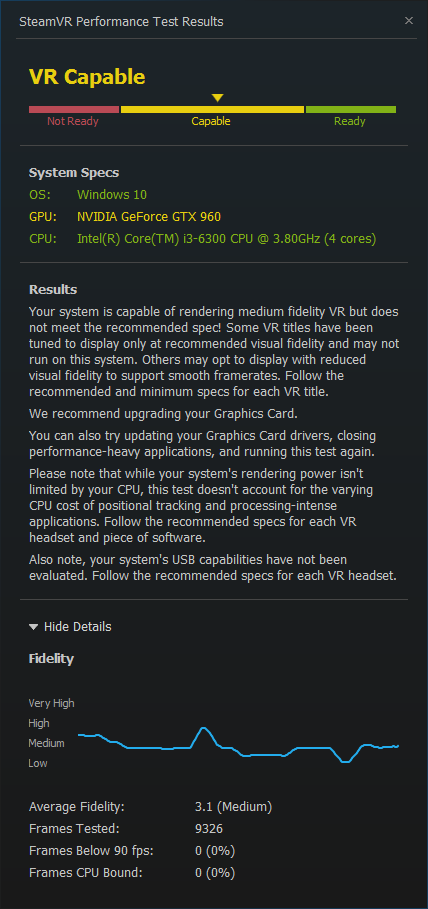
Armed with a Titan X, I started from the top and worked my way down to the bottom of Intel’s product stack, that is, I ran the tests using the Core i7 5960X down to a Core i3 6300 with the same GPU. What I found in my results was that regardless of the CPU used, the results were pretty much the same when staying within the Core family of CPUs. Below is a comparison between tests done with the i7 5960X and the i3 6300.
Nvidia
AMD

What We Learned
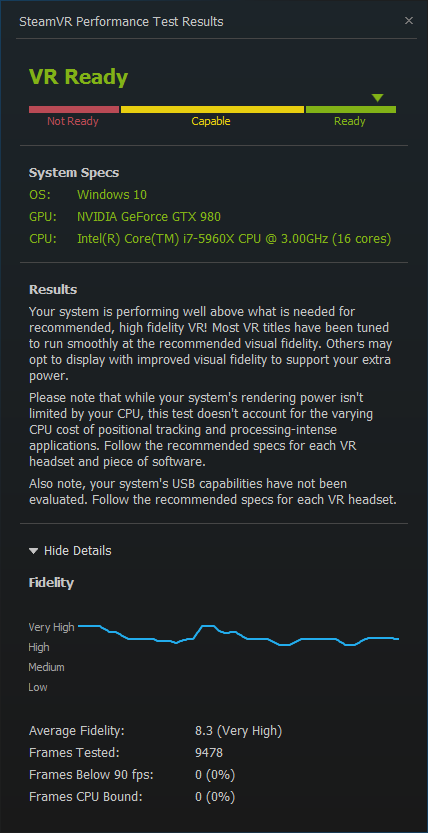
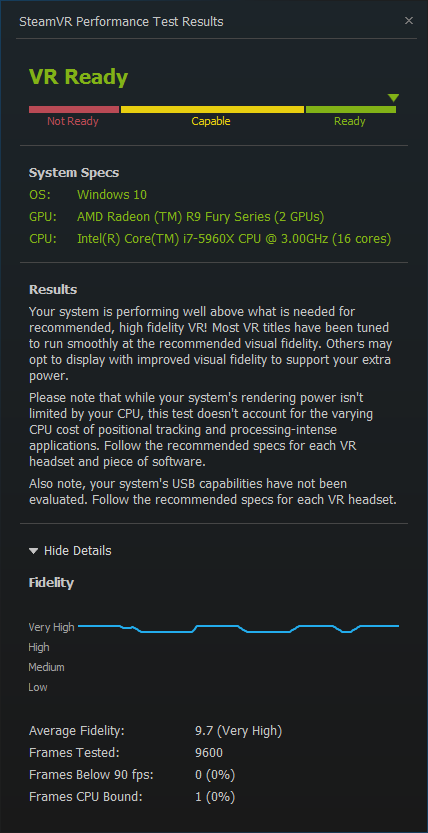
As you can see, the “Average Fidelity” of both results are only a decimal point different from each other, well within the margin of error. The hundred frame difference in “Frames Tested” can be attributed to the CPU’s capabilities, but in a test which renders thousands of frames it makes dwelling on this finding a moot point. The result is that the CPU doesn’t really matter unless you’re looking to squeeze the negligible extra few frames from this targeted test. The CPU is still an important part of any build geared towards VR, but not for the SteamVR Performance Test specifically.
What is “Average Fidelity?”
Before diving into more hardware analysis, we should stop and look at what the results actually mean. The metrics on which capability is measured is the “Fidelity” of the VR render on a scale of “Very High” to “Low,” unlike traditional gaming performance testing which is measured by FPS (frames per second). Valve’s word choice in this instance most likely means how detailed, or “clear” the VR environment would be if your system were to run VR applications. Think of it like turning up or down the details in your games for better performance at the cost of less pleasing visuals, or more eye candy with a hit to your frames count. The availability of VR benchmarks is limited to the Steam VR Performance Test so it is hard to quantify the true value of “Fidelity” that the test produces unlike a universally understood and quantifiable value like FPS.
Valve says that it runs the test to see if “your system is capable of running VR content at 90fps” and “whether VR content can tune the visual fidelity up to the recommended level.” There isn’t too much detailed technical information released by Valve, but from these few general statements I deduced that the tests ran a 90 FPS sequence, then saw where the frame rate dipped below a certain value, hence the generated line chart. The high requirements of the test is most likely due to the fact that the program has to render two of the same environments in tandem. This is in contrast to traditional 3D gaming benchmarks that run a pre-defined sequence of graphics and then gives users an average score (like native benchmarks built into in GTA V, Bioshock, or Battlefield) or calculates this score into an overall value (like the score a 3DMark Fire Strike test will produce).
GPU
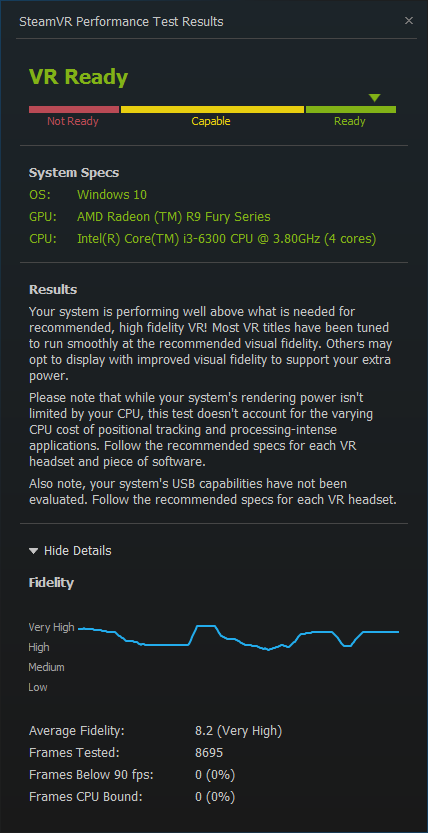
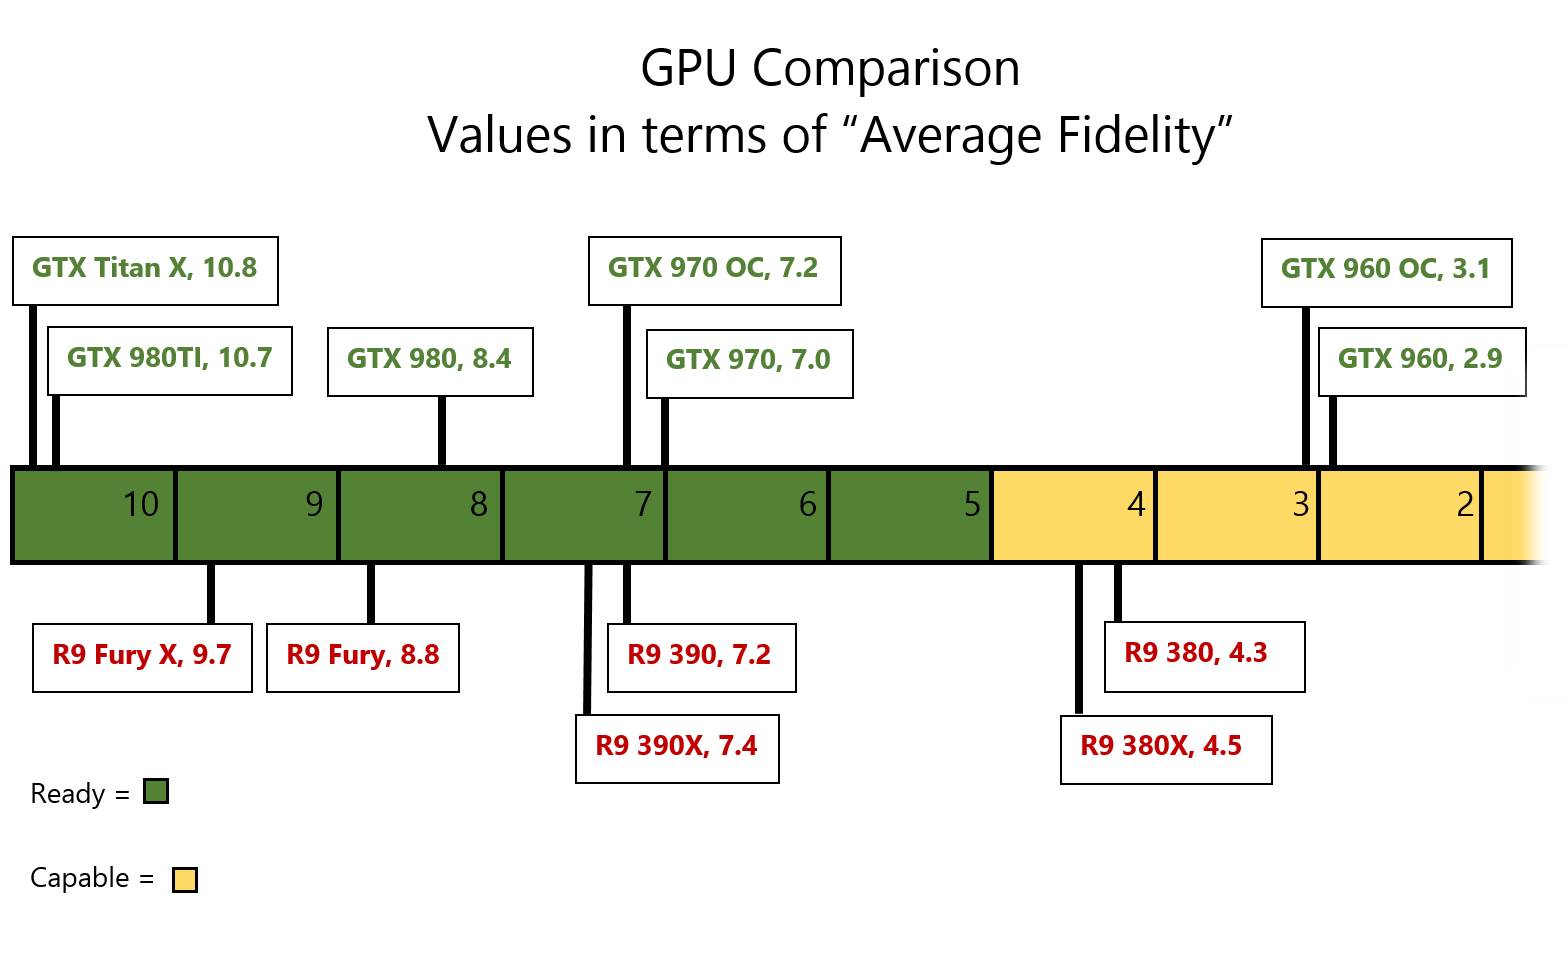
So if the CPU isn’t important, what is? Naturally, I turned to the heart of any gaming oriented build, the graphics card. Starting with a Titan X and a Fury X I worked my way down to the mid-range cards from their respective manufacturers. Below is a diagram illustrating how the SteamVR Performance Test ranked each card.
What We Learned
The results showed that both Nvidia and AMD performed almost in parallel to each other when using cards that are marketed and priced similarly with each other (eg. Nvidia GTX 980Ti and AMD R9 Fury). The Nvidia cards do win over the AMD cards in the higher end, but AMD beats out Nvidia in the mid-range tier of the spectrum. In other words, in terms of raw performance for the SteamVR Performance Test, Nvidia wins at the higher end of the chart but AMD maintains its position as a value leader.
However, even with these numbers the consumer’s decision should also be based upon the two respective companies’ support for VR and exclusive features like ShadowPlay, G-Sync or Freesync and HBM memory. Both companies have shown that they are committed to the future, with Nvidia’s VRWorks API allowing developers to better take advantage of hardware and AMD releasing and promoting products like the Radeon Pro Duo and the Sulon Q headset. Time will tell how the two manufacturers battle it out in the VR space with future hardware releases, software improvements, and optimizations but buying a GPU now, price, power consumption, heat output and compatibility are reasons that should be taken into primary consideration alongside VR capability.
The prospect of diminishing returns is very much alive in the realm of VR. The 980Ti and R9 Fury already hold the highest possible “Ready” qualification by Valve. Spending more to get a Titan X or 295X2 would yield more frames rendered but at a much efficient return for the money. However, the reality holds true with the idea that spending more money now will have the card last longer as new technologies and more demanding games are released.
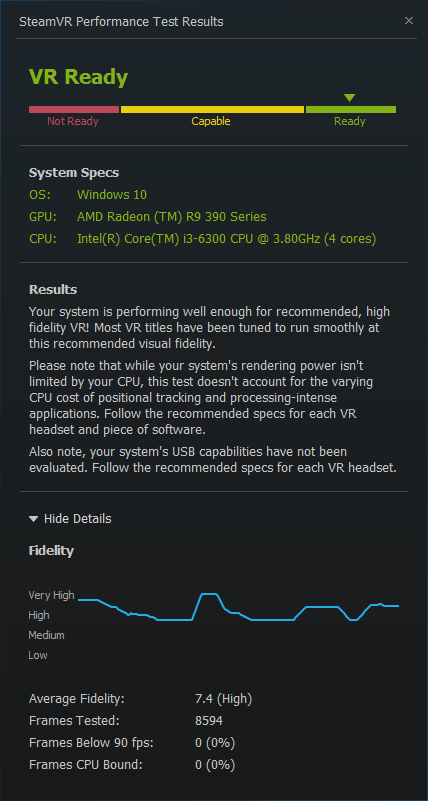
The staggered ranking of the cards show that the SteamVR Performance Test shows that Valve is taking a sand-in-the-line approach to determining VR capabilities. Thus, the key to passing the test is to determine the cutoff model of GPU so that the test will indicate that a system is “Ready” for VR. For the Nvidia lineup, it is recommended to get a GTX 960 for “Capable” performance but best to get a 980 for the “Ready” qualification. For the AMD lineup, it is recommended to get a R9 280 for “Capable” performance but best to get a R9 390X. Valve lists the system requirements on the page for the Steam VR Performance Test as users needing a “GeForce GTX 970 or AMD Radeon R9 290 equivalent or greater” to achieve a “Ready” qualification. Our results came in parallel to Valve’s statement.
What about Multi-Card Configurations?
Another question to answer is how well the test fares in SLI or Crossfire configurations. Adding a second GPU a system to improve performance later on in a machine’s lifetime is a common among budget minded gamers, and building a computer with two GPUs is also a favorite among performance oriented consumers who want more power than what a single card can provide. With multi-card setups commonplace for PC users on both sides of the market, will the SteamVR Performance Test agree with the saying of “two is better than one?”
On the Nvidia bench, I saw only a decimal point difference between SLI and non SLI configurations, again, well within the margin of error. This is to say that the SteamVR Performance Test does not seem to utilize the second GPU when in SLI mode. Most 3D games utilize the second GPU to yield a decent framerate boost, but Valve’s benchmark does not.
On the AMD side, the situation was drastically different. While there was only a decimal point difference on the Nvidia SLI configuration, the SteamVR Performance Test actually recognized when there were two cards in Crossfire, noting “2 GPUs” in the results. The results obtained using 2 Fury Xs boosted the score up 1 in the “Average Fidelity” department.
It is worth mentioning that testing on the Z170 versus the X99 platform yielded different results during testing of the AMD cards. The full x16 lane bandwidth X99 is able to provide allows the benchmark to utilize the second card in Crossfire. The x8 split on the Z170 board does not. This specific shows that the amount of PCI lanes on which a card will operate on may be more important as demanding VR applications come out, or, due to software limitations the card was not able to be recognized by the testing program when used on a Z170 board. Only specific users with X99 boards and AMD video cards would be able to see the performance gained from Crossfire.
Nvidia

AMD
What We Learned
Two is not necessarily better than one in the case of the SteamVR Performance Test. A consensus can be made that the test is inconsistent in accounting for muti-GPU setups at this time due to performance being boosted only with very specific hardware, but, future VR programs will and should most likely take advantage of the second GPU in the user’s system.
What About Overclocking?
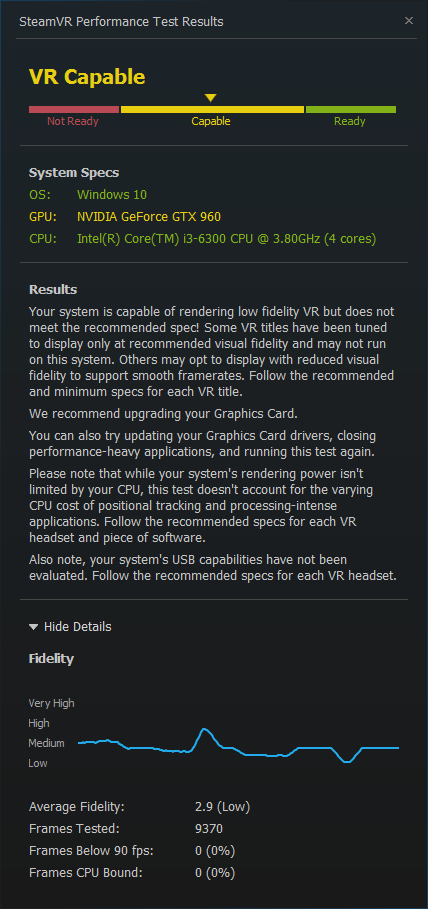
Just as overclocking your GPU can improve FPS in 3D games, a slight overclock can help boost the SteamVR Performance Test’s results by a small amount (.2 points on the “Fidelity”). Using factory overclocked cards with aftermarket coolers, I tested how much of an advantage an overclocked card would give. Below are the results for a stock GTX 960 and a factory overclocked GTX 960 (in this result, the overclock was able to bring up our fidelity from “Low” to “Medium”) as well as a stock R9 390 and a higher clocked R9 390X.
The results could be discredited to a margin of error, but repeated testing of multiple variations of overclocked and stock clocked graphics cards produced a consistent result of a 0.2 difference. Just as overclocking a graphics card squeezes a few extra frames from games, the same logic applies here.
Nvidia:
AMD

Steam’s Disclaimers
![]()
The Steam VR Performance Test advises users that their “system’s rendering power isn’t limited by your CPU.” Valve’s test then, admits to the fact that it has a bias towards the GPU than the CPU. From the results obtained in the CPU testing with a 5960X compared with an i3 6300 validates this statement. The takeaway here is that the Steam VR Performance Test does not account for current or future VR scenarios that require more CPU computation to be done, thus, the results should are somewhat unreliable, and are only a rough indicator of performance.
Valve also disclaims that performance may be limited by the user’s USB capabilities. With some VR headsets utilizing USB as part of their method to interface with the PC (such as the Oculus Rift), it is important to have a strong USB link. The Steam VR Performance Test does not test USB performance.
As more VR tests and benchmarks are introduced, there will be a clearer certainty as to a system’s holistic performance with VR; this test fixates on the GPU the most out of all the components and lays other possible important factors such as CPU power and USB speeds out of the equation.
Conclusion
One shouldn’t take the Steam VR Performance Test too seriously. VR is in its infancy, and like any other new technology there are many more advancements and improvements to come. With popular benchmarking programs that focus on 3D rendering and CPU performance like the institutions that are 3DMark, PCMark and Cinebench, it is important to remember that the Steam VR Performance test stands alone as a publicly accessible, graphics driven test that tests for VR proficiency at the time of this posting when compared to the plethora of programs that have been around for years testing long standing tangible metrics like FPS and rendering time.
Looking at the empirical evidence from our testing suggests that the Steam test is heavily GPU bound and only recognizes multi-GPU configurations in very specific combinations of hardware. The answer then for enthusiasts concerted with what is on the market now is yes; if your system has at least a single 960 or R9 280 can be marked as “VR Ready” but only by the merit of the Steam VR Testing program. Valve understands this and so they tread lightly by giving users a few disclaimers as a reminder that the test is not an authoritative nor definitive solution.
************
For what it’s worth, the Steam VR Performance Test has got us thinking about the exciting to see what hardware and products come out unleash the full possibilities of VR. Soon, system builders will tailor their builds towards VR capability alongside the well-established 30 and 60 FPS standards. Innovative and more life-like experiences will be crafted by creative developers and VR benchmarks and games will be more commonplace as the technology moves forward with highly optimized software within the next coming years. It will definitely be interesting to see what lies ahead in the PC space, the SteamVR Performance test is just a mile marker on the road to a VR centric future.